M.E.T.T.S. - Consulting Engineers > White Papers > Liquified Natural Gas (LNG) Carbon Footprints and the Development of Methodologies for CDM Estimation and Verification
Liquified Natural Gas (LNG) Carbon Footprints and the Development of Methodologies for CDM Estimation and Verification
Dr. Michael C. Clarke*, CPEng, FIEAust, FAusIMM, RPEQ
CEO, M.E.T.T.S. Pty. Ltd.
Consulting Engineers, Resource Management and Infrastructure Development
Gold Coast, QLD, AUSTRALIA
and
Frank van Schagen, B.Com, B.E (Civil), MEngSc, MIEAust, FAICD
Frank van Schagen and Associates, Business Development Consultants, Brisbane, QLD, Australia
*Author to whom correspondence should be addressed: email: metts[at]metts.com.au
Originally published by: Asian Journal on Energy and Environment (ISSN: 1513-4121). As. J. Energy Env. 2010, 11(02), 90-95. Available online at: Asian Journal on Energy and Environment.
Introduction
Natural Gas (NG) is promoted as an intermediate fuel between the traditional fossil fuels (oil and coal) and renewable energies in terms its carbon intensity and footprint. In the following figure, a LNG process train is shown that takes raw gas from a gas-well through to the production and use of LNG. In terms of Clean Development Mechanism (CDM) process nomenclature, this would be business-as-usual (BAU) – the baseline case.
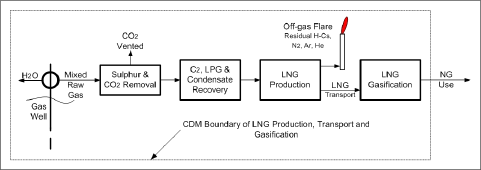
Figure 1a. A basic LNG train – BAU
In the process trains shown above, the products and wastes are:
Table 1. Products and wastes
| Products | Wastes |
| Petroleum Condensate, C5+ Natural Gas Liquids (NGLs) | Nitrogen |
| Liquid Petroleum Gas, Propane (C3) and Butane (C4) | Helium (He), Argon (Ar) |
| Ethane | Sulphur |
| LNG | Carbon Dioxide |
| Water |
In Figure 1, carbon dioxide (CO2) is directly released to the atmosphere at the CO2 separation unit, whilst additional CO2 is produced from the plant flare. There are however also a number of opportunities for the production of fugitive emissions including methane, that will have a major impact on the total carbon footprint of the process.
The LNG Process Train
Separation of water and particulates at the wellhead is the first stage in cleaning the raw natural gas. The second stage is the removal of the acid gases, carbon dioxide (CO2) and hydrogen sulphide (H2S), plus the removal the remaining water. In these processes some methane (CH4) can find its way into the CO2, H2S and residual water streams. This methane could be recovered, but given that it should be in relatively low concentrations, oxidation (combustion) to water and carbon dioxide would be an appropriate treatment/disposal option. At this stage the separated carbon dioxide could have and industrial market (industrial gas, enhanced oil recovery (EOR)) or be disposed of by geo-sequestration; whilst if the sulphur concentration and volumes are sufficient, sulphur recovery by the Claus process would offer an additional economic product.
The next stage in the LNG process train is the recovery of liquids (petroleum condensates) thence C2+ gases (ethane, propane and butane). These are valuable products as long as they are in sufficient quantities. If not, they should be considered for fuelling power generation to run the entire/part of the LNG process train.
The LNG production process is essentially the cryogenic separation of methane from other gases with lower boiling points. The process separates methane (as a liquid) from gaseous nitrogen, and sometimes helium and argon. The process is efficient, especially in terms of producing a ‘pure’ liquefied natural gas product that meets international standards, but some residual hydrocarbons (H-Cs) pass through the LNG plant and become a component of the LNG Off-gas. These H-Cs can be flared, or recovered and recycled.
Energy Demand and Carbon Footprints from LNG Processing and Utilisation
In the LNG process train, there is need for compression, cryogenic refrigeration and gasification of product LNG, with each process consuming energy. The movement of product, by-products and wastes through the LNG train also require energy. The transport of LNG requires energy, which in the case of sea transport may come from the direct use of ‘boil-off’ gas from the LNG tanks.
Emissions from LNG transport are very dependant on the distance between the production train and the end-use. They are significant but are indeterminable outside defined project boundaries. They will not be further considered in this discussion, and therefore Figure 1a is simplified to Figure 1b.
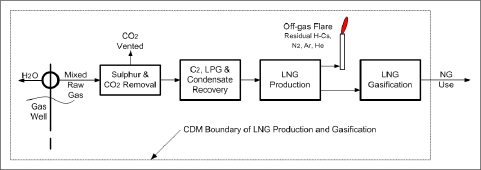
Figure 1b. A basic LNG train without consideration of LNG transport - BAU
Helium separation and recovery
Helium is recovered from natural gas resources. Natural gas can contain helium concentrations ranging from zero to over six percent (v/v). Helium has become an important strategic gaseous mineral and recent shortages have seen the price of helium double [1].
Helium production has been dominated by the United States (US). The US has (had) a series of gas wells in the south-west of the country that had exceptionally high helium concentrations. The helium was associated with carbon dioxide, nitrogen and hydrocarbons. In some instances helium was the only recovered product from the wells. In the last twenty years, the dominance of the US in helium production and supply has diminished. Now such countries as Russia, Australia, Algeria and Qatar have viable helium production units. In 2008 the US still produced around 80% of the World’s helium (and has substantial stored reserves) but this percentage is expected to fall with new plants coming on-line in Algeria, Australia and Qatar [1 & 2].
The change from recovering helium from wells with high helium concentrations to wells with low helium (and now very low concentrations) has come about from the availability of LNG Off-gas with readily recoverable helium contents and the development of new technologies that can be applied to helium separation such as pressure swing adsorption (PSA).
Gas wells with helium concentrations of greater than 0·3% can be commercialised essentially for their helium content [3]. Other natural gas reserves with helium concentrations as low as 0·04% can have viable helium by-product streams. (In India, the processing of one such natural gas resource promises to make India self-sufficient with the strategic mineral helium [4].) With very low concentrations of helium in raw natural gas, the economic driver in making the LNG Off-gas a viable helium resource, is the very high concentration factor that can come through stripping out virtually all other gasses in the LNG process combined with large total throughputs of total gas through the LNG system.
The addition of a helium recovery plant can also lower the direct emissions of carbon dioxide through the flaring of LNG Off-gas. (Note: Where LNG Off-gas had very low concentrations of hydrocarbons, some additional gas (fuel) input is required for flare stabilisation, thus increasing the overall carbon emissions.) The helium separation plant plusand a helium liquefaction plant will also require significant energy per unit of product, this energy being for compression, liquefaction and product transport.
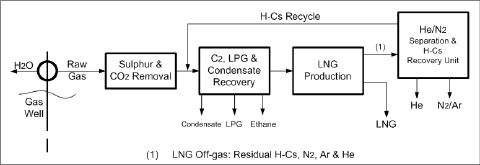
Figure 2. A LNG train with helium (and other by-product) recovery
For the process train shown above, the products and by-products are:
Table 2. Helium recovery products and by-products
| Principal Products | By-Products (Wastes) |
| Petroleum Condensate, C5+ Natural Gas Liquids (NGLs) | Nitrogen |
| Liquid Petroleum Gas, Propane (C3) and Butane (C4) | Argon (Ar) |
| Ethane | Sulphur |
| LNG | Carbon Dioxide |
| Helium (He), as Compressed Gas (CHe) or Liquefied Gas (LHe) | Water |
The operation of the helium recovery plant produces some hydrocarbon (H-C) residuals, which could be recovered (recycled), as shown in Figure 2 or flared as shown in Figure 1. Those hydrocarbons could also be utilised for power generation, with the power being used in the LNG trains and in the helium separation and liquefaction plant(s). There are however a number of opportunities for fugitive emissions, emissions that will have a major impact on the total process carbon footprint. The fugitive emission that will have the greatest influence on the carbon footprint will be methane, with its Global Warming Potential (GWP) of 21.
The CDM boundary for LNG and Helium production could encompass both processes, or there could be a boundary for each process. Figure 3a shows separate boundaries whilst Figure 3b shows a single boundary. The products of the helium plant are liquid helium (LHe), compressed helium (CHe) and by-product gases, with would include residual hydrocarbons (principally methane), argon and nitrogen.
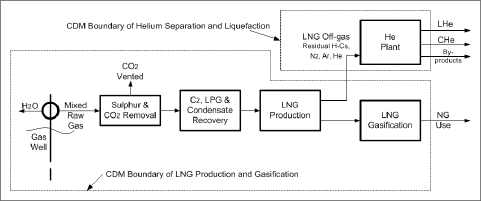
Figure 3a. Separate process boundaries for LNG and helium production
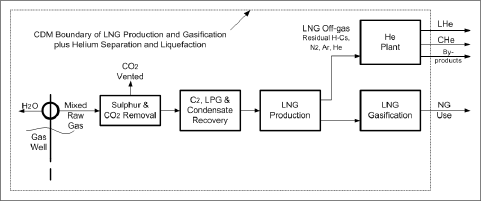
Figure 3b. Combined process boundaries for LNG and helium production
The choice of adoption of processes shown in Figures 3a or 3b will largely depend on the degree of integration of the LNG and helium process trains. Another consideration will be the ownership and management of the respective plants, and the contractual arrangements between owners and managers. In the ideal situation a high level of integration would be desirable where energy conservation, emissions control and emissions recovery between processes can be maximised.
CDM and LNG
A Malaysian LNG project, the Bintulu LNG plant, Sarawak, looked at the capture and storage of carbon dioxide. A CDM project design was produced in 2005/6 and a new methodology (NMO 168) was written [5]. In 2006 the proposed methodology was rejected, principally on the grounds of uncertain monitoring systems for CO2 seepage (ensuring the integrity of CO2 storage), and poor understanding of the function of the flare incineration system for acid gas processing[6].
The requirement for ‘additionality’, that being the proposed carbon emissions management scheme would not occur if it were not for the possibility of generating income from the CDM activity (i.e. the creation of CERs) was also not demonstrated in Bintulu proposed methodology. The concept of the Bintulu proponents was also to send CO2 off-shore to saline aquifers or abandoned oil/gas fields, reservoirs that may have been outside Malaysia’s borders (i.e. in international water). This transport of CO2 to jurisdictions outside the jurisdiction where the CO2 was generated was found not to be acceptable [6].
A major part of producing a CDM methodology, is defining the boundary of the project. This is normally done in a schematic way, as suggested in Figures 1a, 1b, 3a and 3b above. It can be noted that the suggested methodology with respect to boundary definition of the Bintulu project was found to be adequate [6].
The experience of the Bintulu CDM methodology proponents points to the requirement to better understand the carbon baseline of what is being proposed. In projects that incorporate helium recovery, consideration should be given to the merits of having individual process boundaries for LNG and helium, or otherwise considering both processes as one continuous process where raw natural gas is separated into components, with two products being LNG and liquid helium. The delineation of sources of carbon emissions is important, and in the case of the two process boundaries the accurate proportioning of carbon will need to be undertaken.
Conclusion
In proposals where the reduction in emissions is coming from improvements in fugitive emissions management, then monitoring that provides sufficient certainty over BAU emissions should be eligible for the creation of CERS. In the future, LNG based methodologies presented to the Methodology Panel of the UNFCCC should be eligible for the creation of carbon credits if a solid baseline can be decided, and eligible emissions are well documented.
The question that needs to be asked is: If a LNG production unit situated in a developing country, (with or without helium capture) really needs the financial support that CDM and the creation of CERs brings, is the project really viable? However, regardless of the answer to this question, the CDM accreditation does indicate good environmental performance with respect to carbon emissions and this may be sufficient reason to consider the challenges of CDM accreditation.
References
1. Helium on the Rise: the global helium shortage — managing tight supply, strong demand and rising costs. An Air Products Special Report, CryoGas International, March 2008
2. Clarence Hardy, Glenhaven Consulting, Commercial Report on Helium Supply, 2009
3. U.S. Geological Survey, Mineral Commodity Summaries, January 2008, pp 78/79
4. Indian helium breakthrough. Rob Cockerill, www.gasworld.com, 15 May 2008 (web based reference, assessed December 29, 2009)
5. Clean Development Mechanism, Kumagi Tsukasa, Mitsubishi Research2006, UNFCCC web site, accessed January 2010
6. UNFCCC Document Number, F-CDM-NM0168, June 2006, UNFCCC web site, accessed January 2010
NOTE:
You are welcome to quote up to a maximum of three paragraphs from the above white paper, on condition that you include attribution to this website, as follows:
SOURCE: M.E.T.T.S. Pty. Ltd. Website http://www.metts.com.au
Share this page:
M.E.T.T.S. Pty. Ltd. - Consulting Engineers PO Box 843, Helensvale QLD 4212, Australia TEL: (07) 5502 8093 • (Int'l) +61-7-5502 8093 EMAIL: metts[at]metts.com.au Copyright • Privacy • Terms of Use © 1999-2014 M.E.T.T.S. Pty. Ltd. All Rights Reserved. |

